ML Interview Question: Explain box plot in detail and how it can be used in detecting outliers.
Options
Answers
-
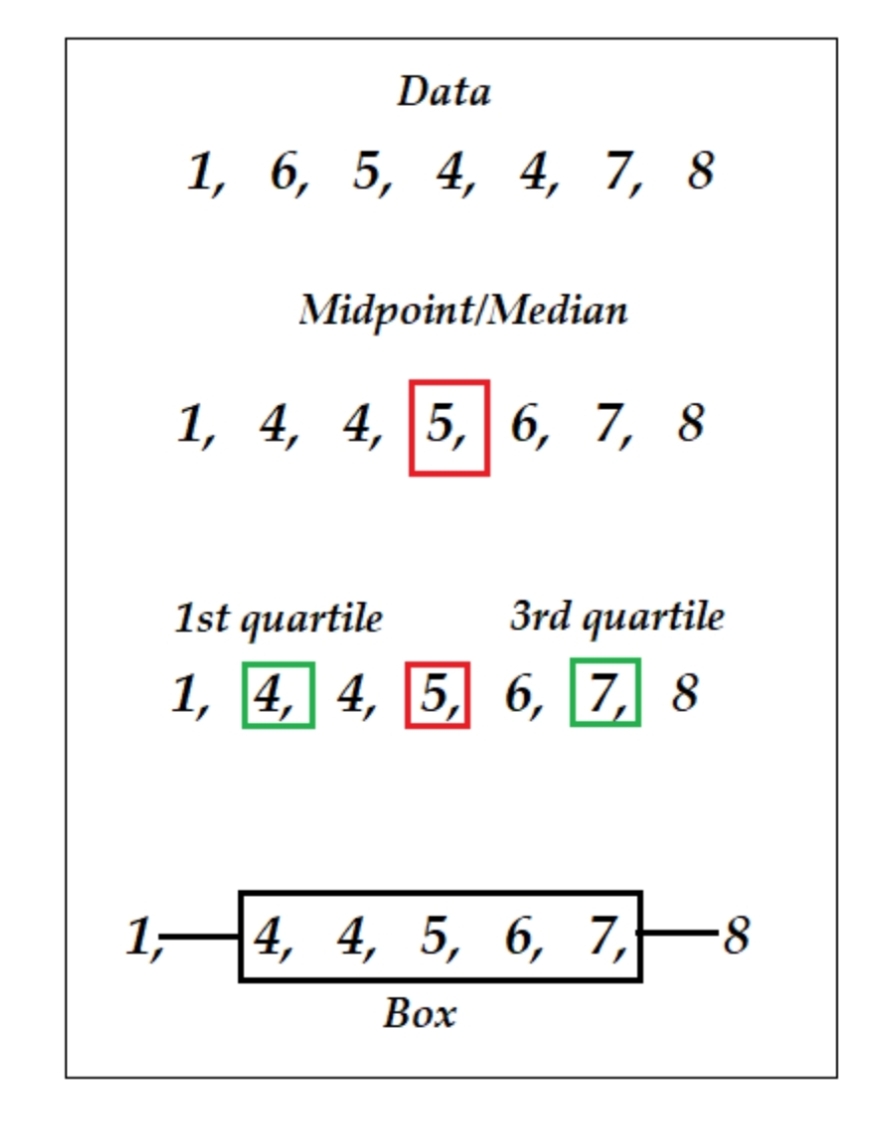
 In the boxplot below, the length of the box is IQR, and the minimum and maximum values are represented by the whiskers. The whiskers are generally extended into 1.5IQR distance on either side of the box. Therefore, all data points outside these 1.5IQR values are flagged as outliers.
